Problem Definition
The type of spatial networks we will focus on in this contest are utility networks. A utility network is subdivided into a set of zones or circuits. Each zone or circuit has a special set of vertices called controllers from which resources flow. We will operate under the assumption that the zones or circuits are source-based (e.g., electric, water, and gas networks), meaning that resources will flow from controllers to the rest of a zone or circuit (note that zones can also be sink-based such as in gravity-fed networks, e.g., sewer networks, where resources flow towards the controllers). The main tasks in this contest are to build the network topology and to infer flow direction in a source-based network such that features that are upstream to starting points can be identified. Here we use the term "starting point" to indicate the location where the analysis starts, i.e., the feature for which we are trying to identify upstream features. A feature is considered to be upstream if it is on a path which contains no repeated vertices (i.e., a simple path) between a starting point and a controller. In looped topologies, flow direction is assumed to be bidirectional.
The problem definition is as follows:
Input:
- A collection of point features representing devices and junctions
- A collection of line features
- A set of controllers, which are a subset of the device features
- A set of starting points, S, where S is a subset of the device, junction, and line features
Output:
All upstream features (a feature is considered to be upstream if it is on a simple path between a starting point and a controller).
Objective:
Computational efficiency
Examples

Figure 1 shows an example input and output of the problem. The input consists of a collection of point features, represented by vertexes v1, v2, v3, v4, s1, a collection of line features, represented by the edges between each vertex, one controller c1, and one starting point s1. The output is all upstream features which are highlighted (i.e., vertices s1, v3, v1, c1 and edges (s1, v3), (v3, v1), (v1, c1)). Vertices v2 and v4 and edges (v1, v2), (s1, v4) are not part of the upstream results because they are not on a path between the starting point s1 and controller c1 which contains no repeated vertices.
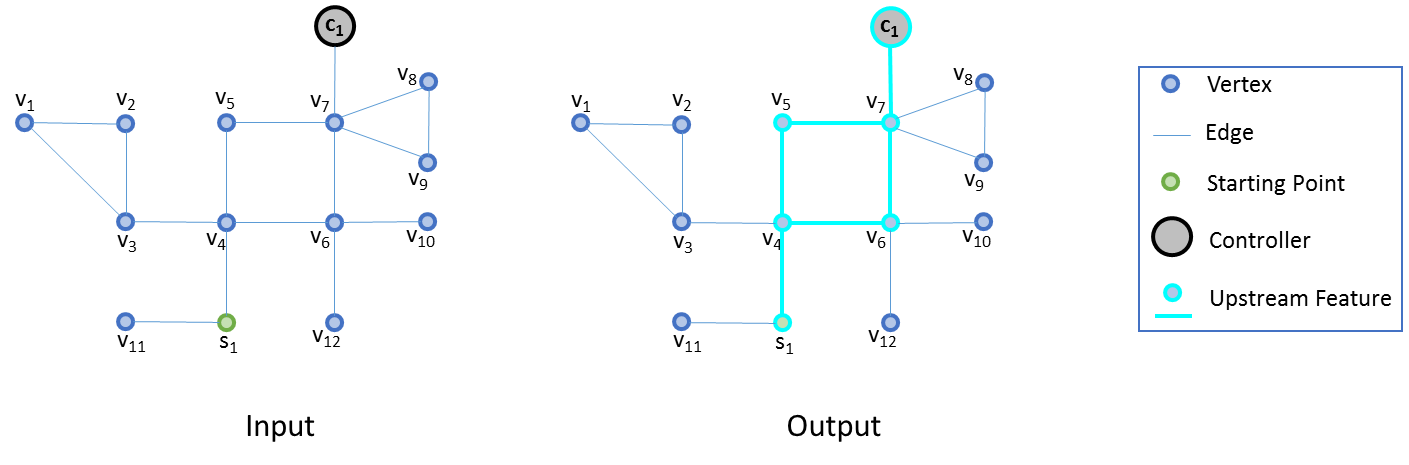
Figure 2 shows another example input and output of the problem in a looped topology. The input consists of a collection of point features, represented by vertexes v1 – v12, and s1, a collection of line features, represented by the edges between each vertex, one controller c1, and one starting point s1. The output is all upstream features which are highlighted.

If multiple controllers are present, all upstream features to each controller must be considered (i.e, features on a path between the starting points and the controllers). An example of this is illustrated in Figure 3. The input is almost identical to the input of Figure 2, except in this case there are two controllers (c1 and c2). The upstream features are highlighted.

Another example of identifying upstream features in the sample electric network that has been provided is shown in Figure 4. In this example, the starting point is in the northeast corner of the figure and the controller is in the southwest corner of the figure. The upstream features between the controller and the starting point are highlighted.